
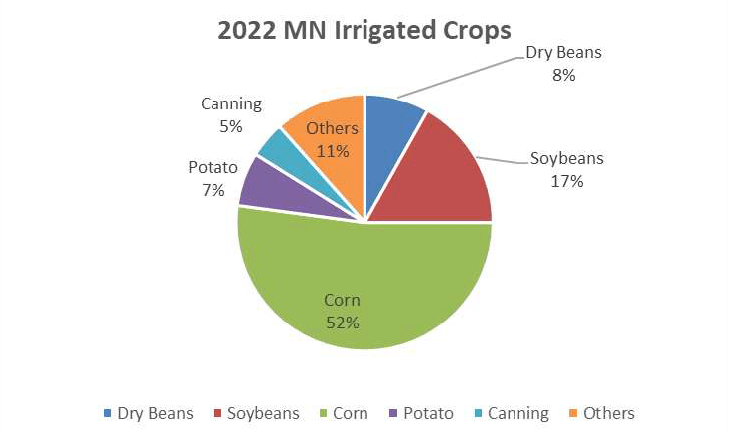
In a comprehensive snapshot of Minnesota’s irrigated agriculture, the pie graph below delineates the composition of irrigated crop types for the year 2022. Based on meticulous reports from irrigating farmers to the Minnesota Department of Natural Resources (DNR) in February 2023, this visual representation is derived from a total of 673,222 acres.
Historical Trends – Annual Permitted and Reported Irrigated Acres
Delving into historical context, the lower graph portrays the trajectory of annual permitted and reported irrigated acres since the 1960s. This historical perspective offers insights into the evolving landscape of irrigation practices in Minnesota.

In 2021, Minnesota irrigators reported applying water to 707,316 acres preceded in 2020 with 650,870 acres and 610,841 in 2019.
Insights from USDA Minnesota Crops Report (2020):
According to the USDA Minnesota Crops report for 2020, irrigated corn harvested acres represented 3.4%, while irrigated soybeans covered 1.8% of the total crop acreage. The combined irrigated corn and soybeans acreage accounted for 2.7% of the total state crop acreage.
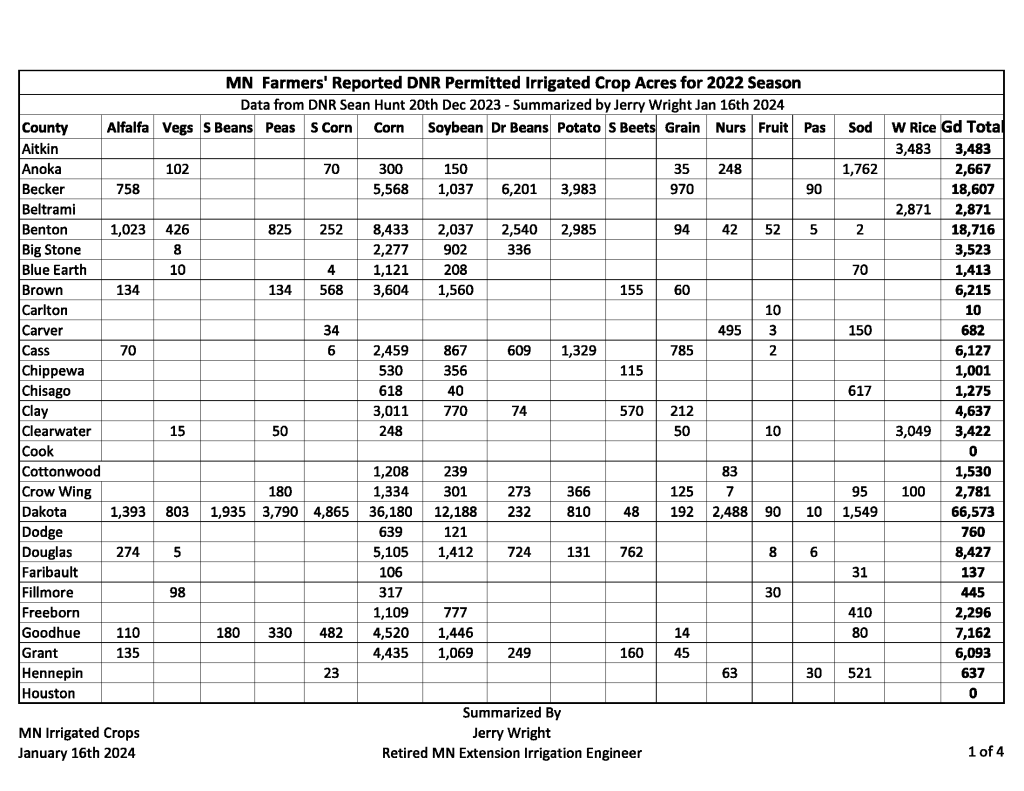
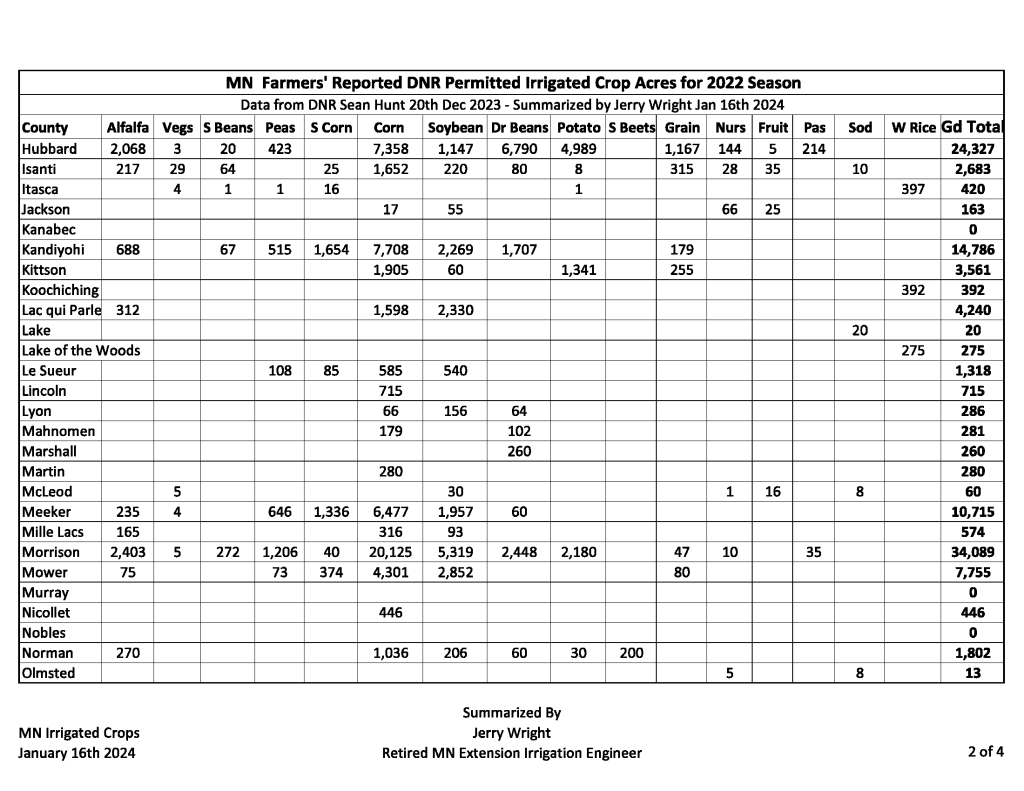
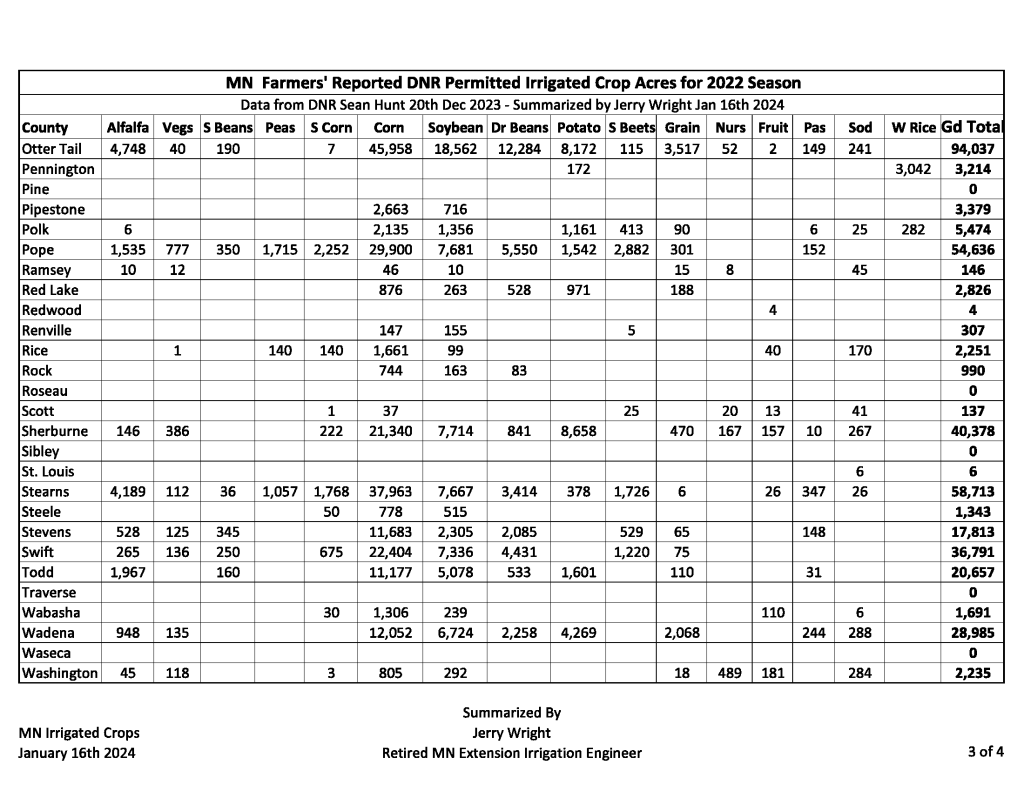
Complete Table of Irrigated Crop Acres (2022) by County:

This rich array of data not only illuminates the current state of irrigated agriculture in Minnesota but also invites a reflection on its historical evolution. The commitment of farmers to efficient irrigation practices and the dynamic nature of crop types underscore the resilience and adaptability of Minnesota’s agricultural landscape.
Exploring Detailed Data – Contact Jerry Wright:
For those seeking more in-depth information or specific inquiries, Jerry Wright, retired University of Minnesota Extension Irrigation Engineer, can be contacted at jerrywright1970@gmail.com.
You can also find information on our Resources page.
